
 Visualization & Graphics
Visualization is a key step in analyzing and working with data. It is possible to create simple, easy-to-customize visualizations and even automate the process for a variety of data from multiple different sources. Learn how you can include great-looking visualizations in everything from personal data explorations to reports and academic papers.
These courses help you create cognitively and aesthetically compelling visuals and infographics. They also explain how to interactively share any type of data, including stylized plots, charts, 3D graphics and dynamic visualizations. Certification opportunities are available for proficiency in data science and visual explorations using Wolfram Language as well as for completion of specific courses.


Upcoming Events
-
MAY 8 | Online
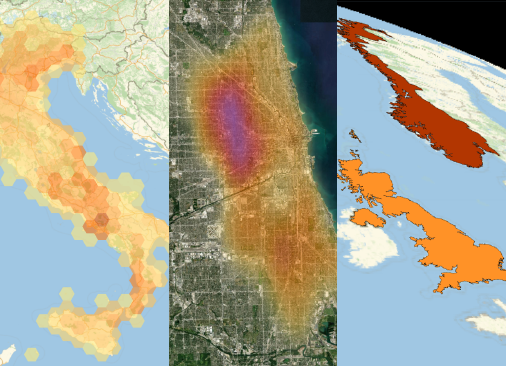
Getting Started with Geographics: A Beginner's Guide to Working with GIS, Projection and Primitives
Geo data brings particular challenges when creating impactful and clear visualizations. This training will introduce Wolfram Language's geo visualization libraries and show how to handle the key issues of projections and context to produce a range of compelling images.
-

Jun 6 | Online
Quick Start to Wolfram Tech
This course introduces core technologies for getting started quickly with the Wolfram technology stack. Learn to work with Wolfram Notebooks in the cloud as well as on your desktop and familiarize yourself with the syntax and programming fundamentals of Wolfram Language.
-

Jun 13 | Online
Data Visualization with Wolfram Language
With the use of a curated dataset from the Wolfram Data Repository, this course shows how to quickly visualize different data structures and how to make your graphics ready to publish and share. Domain-specific functions and general techniques are shared for getting the most out of your graphics.