WolframVisualizationA CORE PART OF
WOLFRAM LANGUAGE
Scientific, Data & Function Visualization.
Wolfram visualizations simplify and automate the creation of plots used to understand data and functions for everything from personal explorations to reports and published papers.
Pick the Perfect Plot
Choose from hundreds of plots and charts for everything from monthly spending and temperature trends to mathematical functions, vector fields, molecular structures and more. Rich documentation includes hundreds of examples per type.
Simply Great-Looking Plots
Create attractive plots with highly automated computational aesthetics and graphic design that make intelligent choices for default plot appearances. Curated plot themes cover everything from bold and impactful for presentations to detailed and insightful for publication.
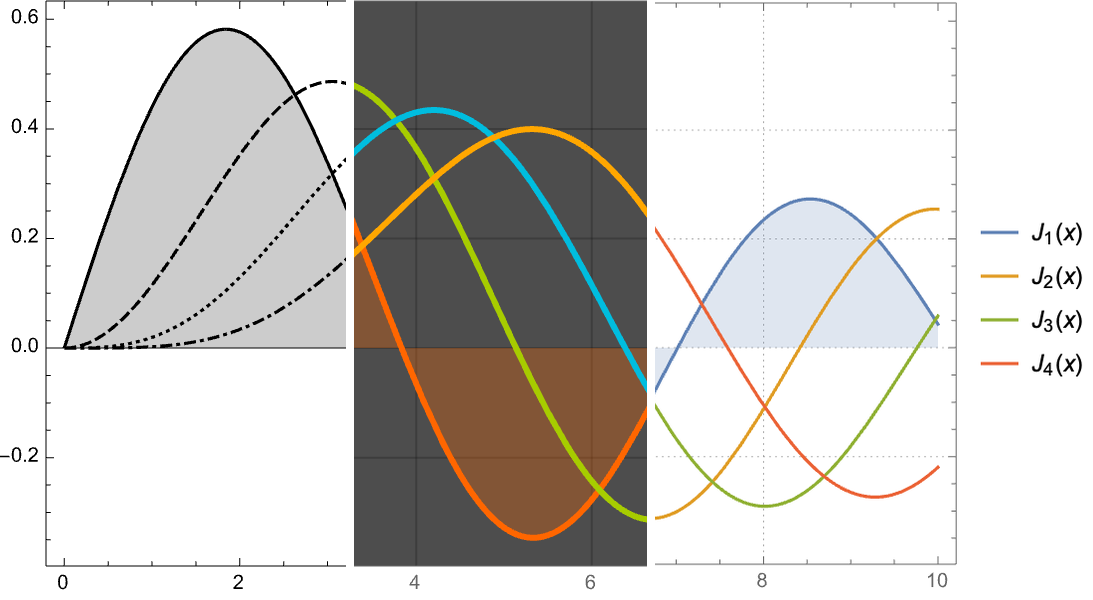
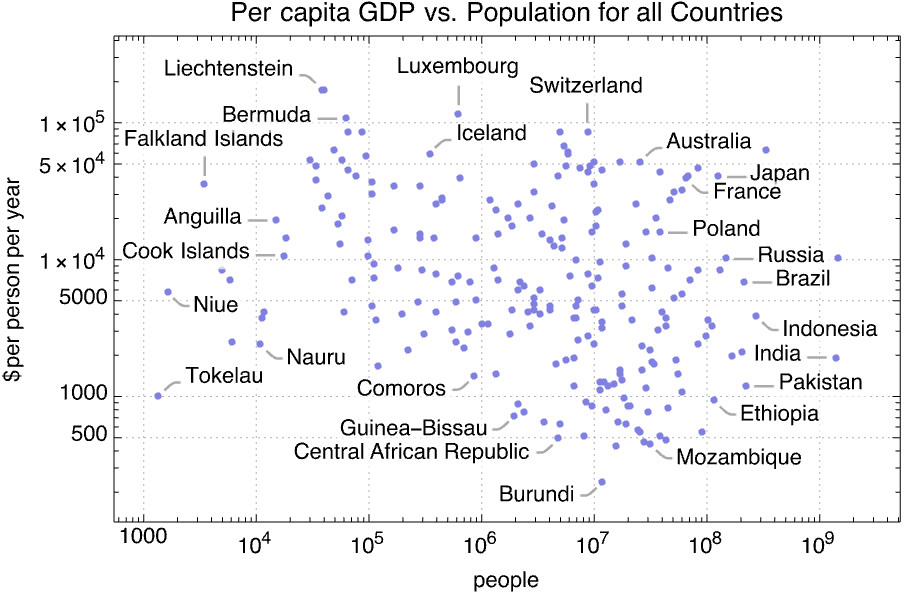
Label Everything
Make visualizations instantly understandable by adding legends or labeling different parts with text, formulas, images and more. Automatic algorithms compute optimal label positions around points, curves and surfaces.
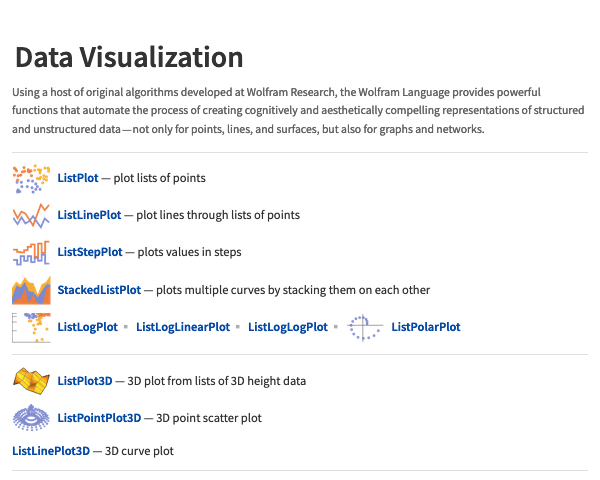
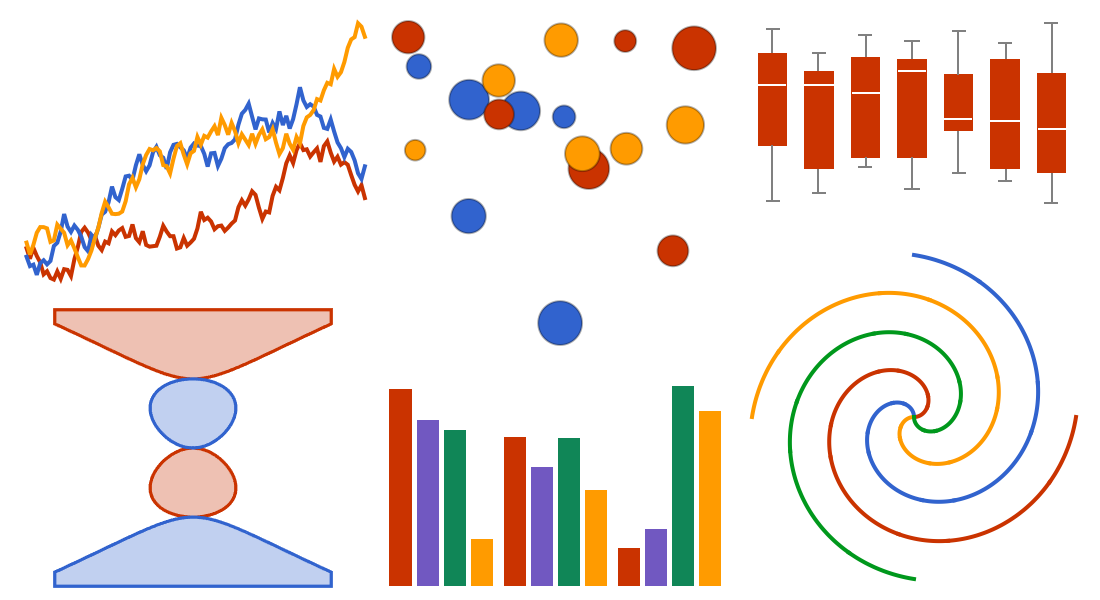
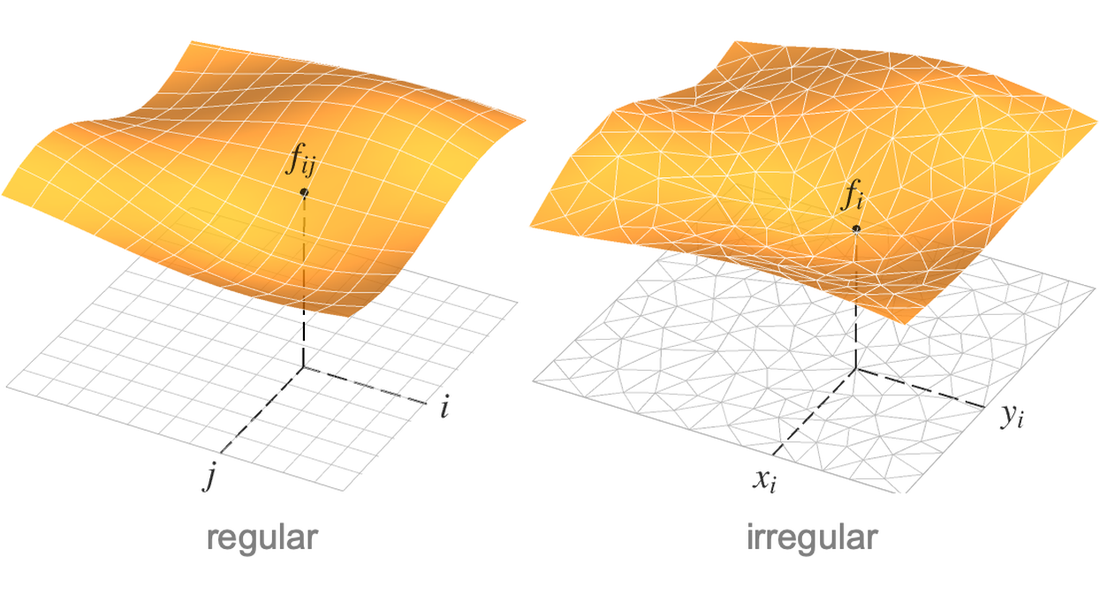
Data Visualization
Visualize data of any form and dimension, from points to curves and surfaces, volumes, vector fields and more. Plot tabular data from spreadsheets or irregularly measured data points. Automatically handle rich data with dates, units, error bars or missing values.
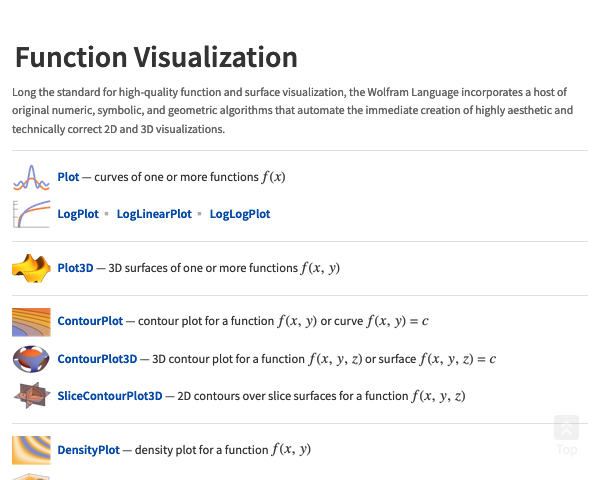
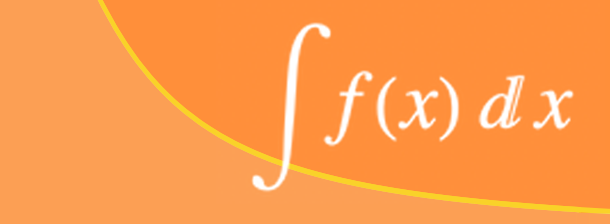
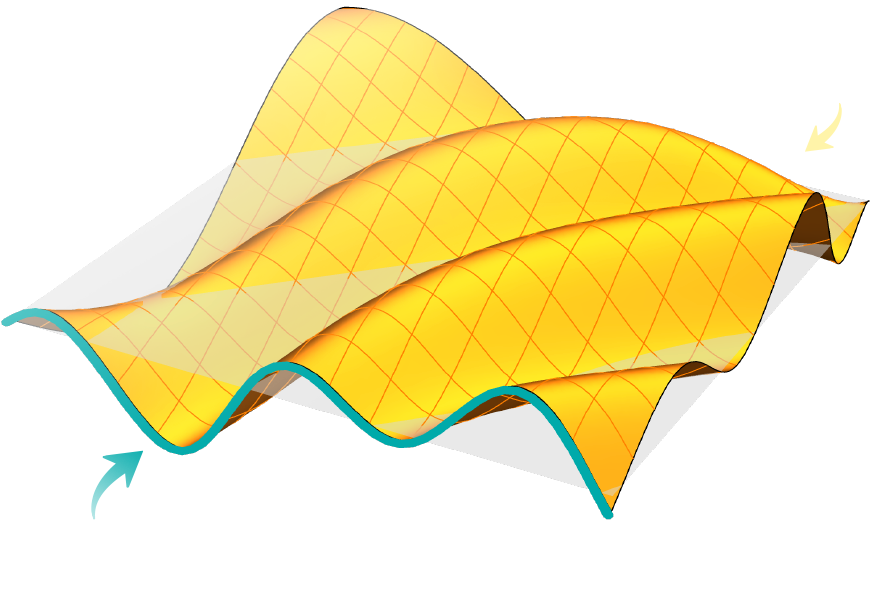
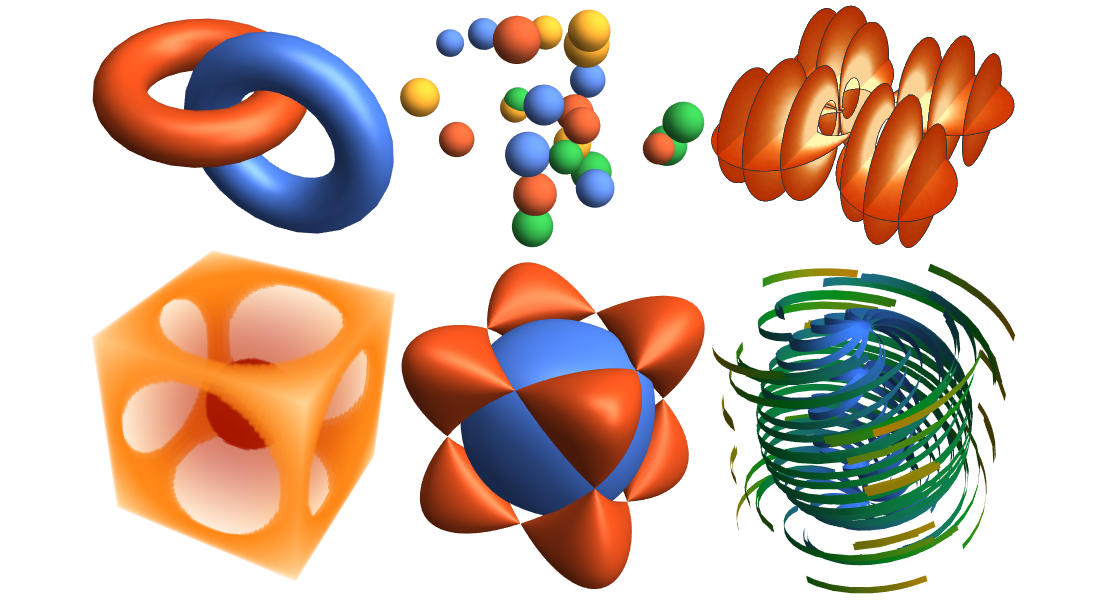
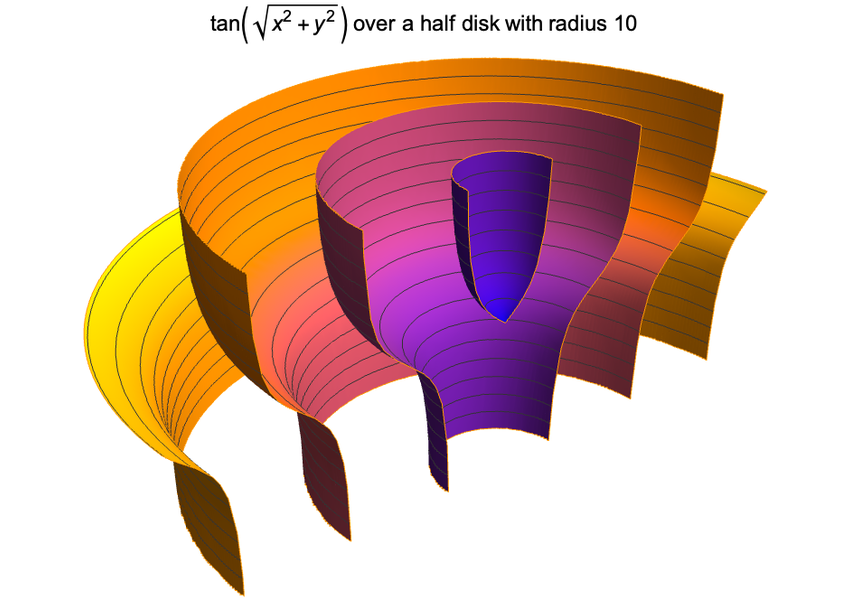
Function Visualization
Seamlessly visualize functions and inequalities over geometric regions. Adaptively sample for smooth-looking plots and automatically generate cuts for singularities in curves and surfaces.
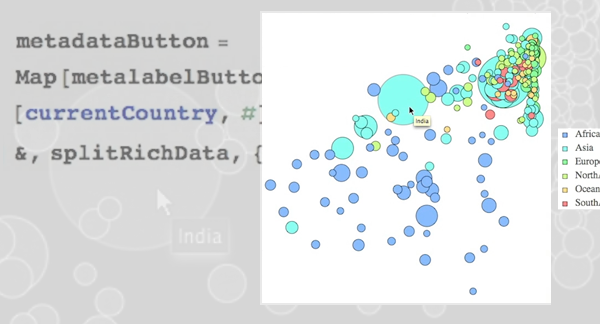
Interactive Visualization
Interactively explore parameters in models and functions to gain a better understanding of data and functions. Immediately see effects of adjusting parameters or see how data changes over time.
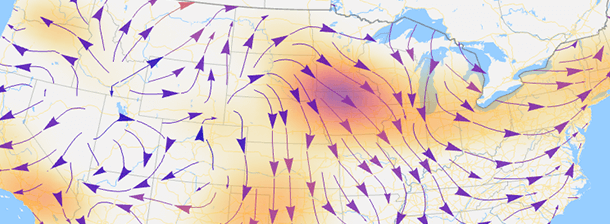
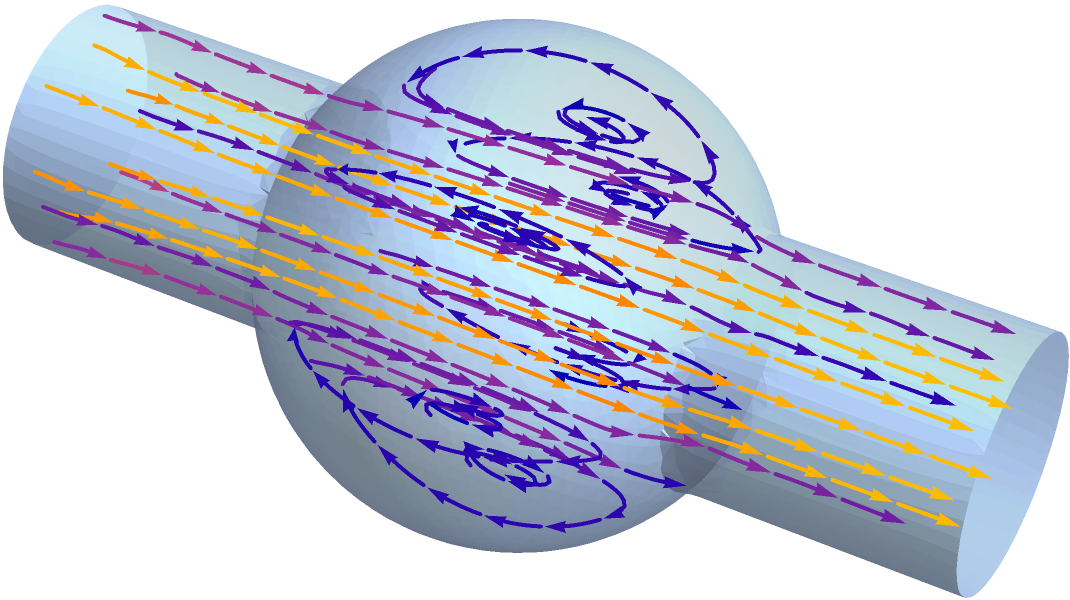
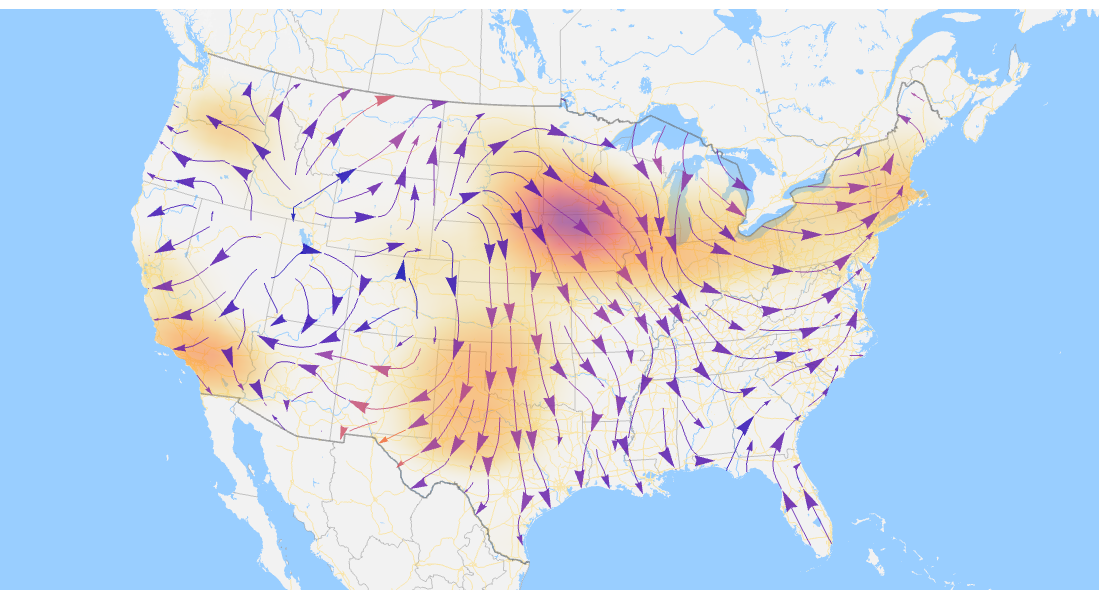
Vector Visualization
Picture vector fields such as wind velocity, water flow, gradients or electromagnetic fields. Show direction and magnitude with arrows, stream lines and deformations in 2D and 3D. Identify sources, sinks, cycles and other features globally.
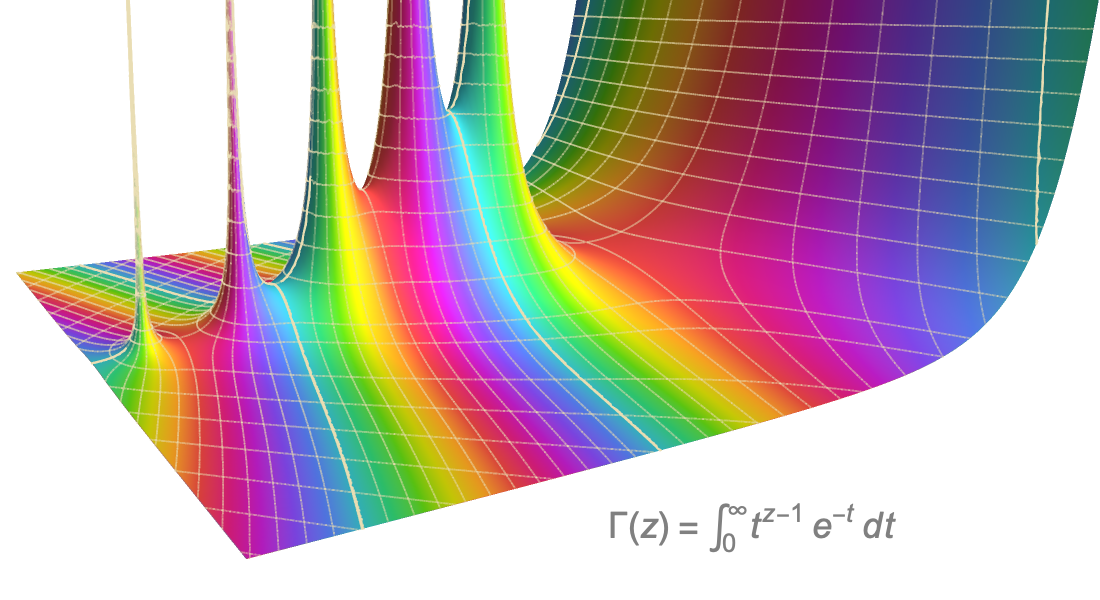
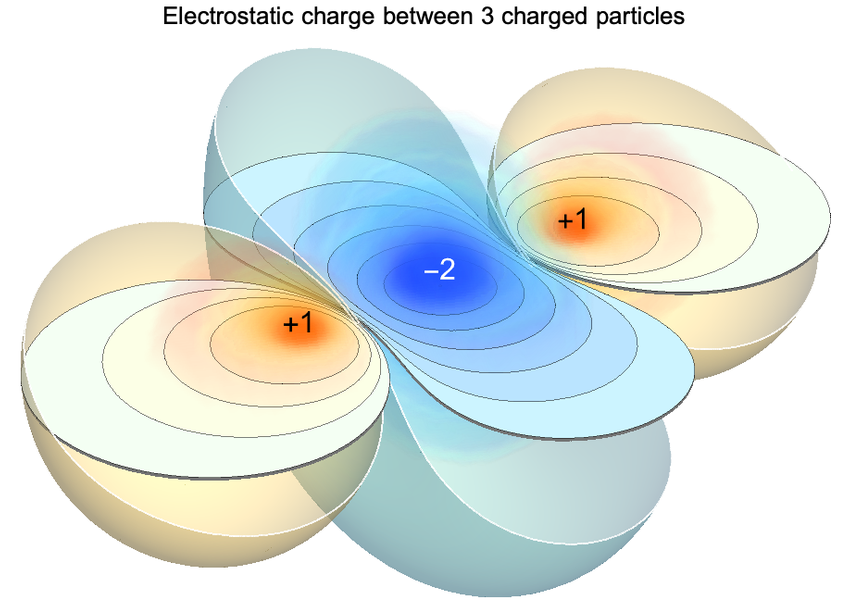
Complex Visualization
Understand the full behavior of complex-valued functions by plotting them directly over complex- and real-valued domains to visually locate zeros, poles and other features. Visualize complex numbers using their Cartesian or polar forms, or as vectors, combined with rich coloring schemes.
Volume Visualization
View inside volumetric functions and data. Vary the transparency of volumes to see the most interesting portions. Slice into 4D data with arbitrary surfaces to identify features that would otherwise be hidden.
Geo Visualization
Answer the "where" as well the "why." Overlay scalar, vector, graph and density data on maps for immediate spatial insight.
Create Customized Visualizations
Customize plots like a pro. Modify native plots by adjusting colors, styles and visual elements; combine them with other graphical elements for rich visualizations; build entirely new types of visualizations with a descriptive underlying graphics language.
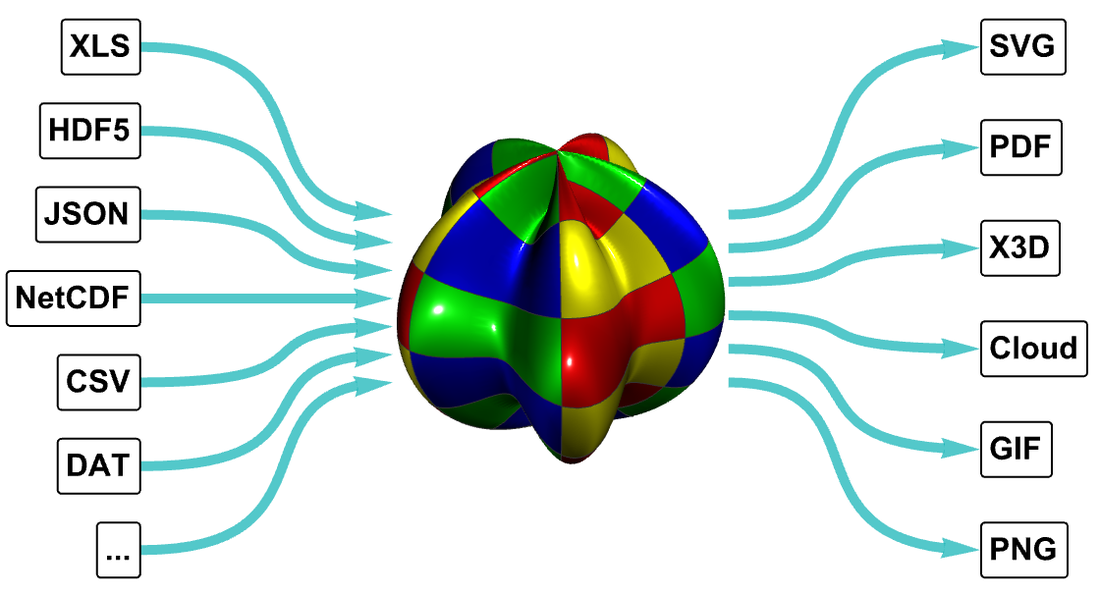
Read, Plot, Share
Read data in a wide range of file formats, including CSV, XLS, HDF5 and more. Tell the story of your data with the right visualization. Share your creation with anyone, anywhere. Tweet animated GIFs, publish crisp vector graphics in PDF, deploy live graphics in notebooks or 3D print your plots.
- Export graphics as raster, vector, or 3D formats
- Guide to Importing & Exporting
- Wolfram Demonstrations Project
Wolfram Visualization Documentation
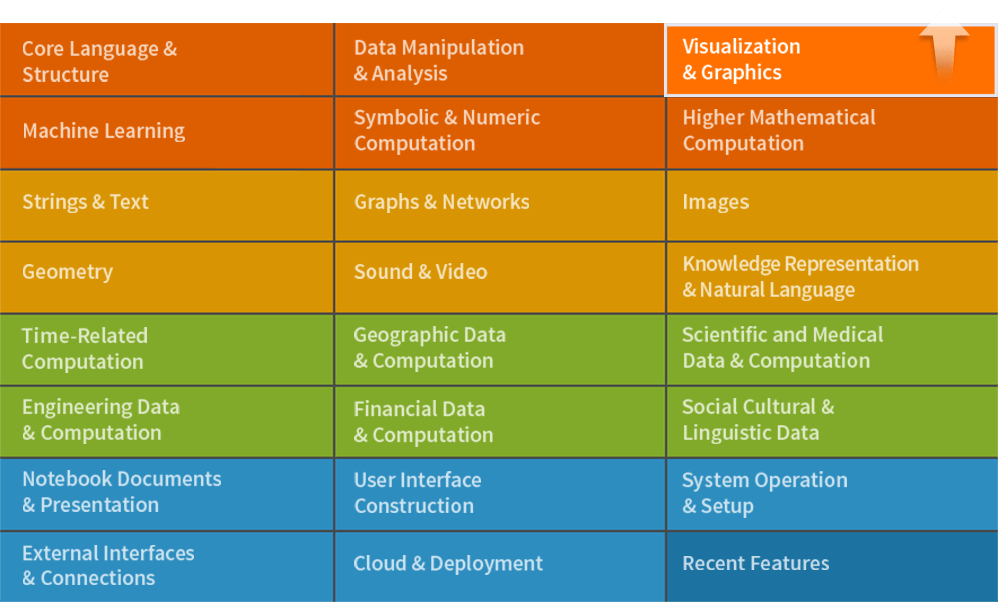
Wolfram Visualization is an integrated part of Wolfram Language. The full system contains over 6,000 built-in functions covering all areas of computation—all carefully integrated so they work perfectly together.
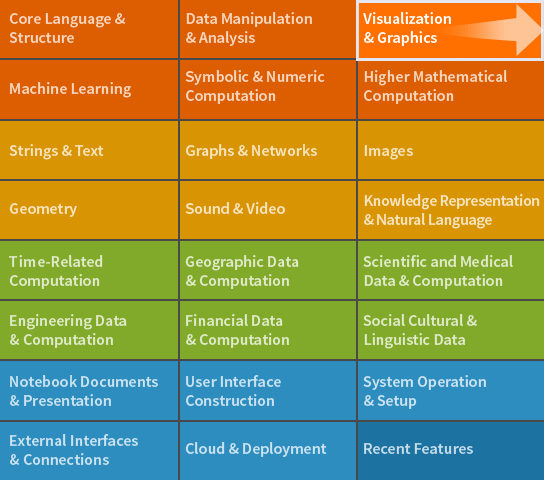
 Wolfram Language
Full Scope & Documentation